Everyone has some data system.
It could be a sales system where one or more branches sell products.
It could be a production system where branches produce components and ship them to recipients.
The quality of sales or the state of the production process can be analyzed by managing managers in various ways. One way is to import data from the sales system into Excel.
After updating the data, you can then view previously prepared charts. And everyone can be happy.
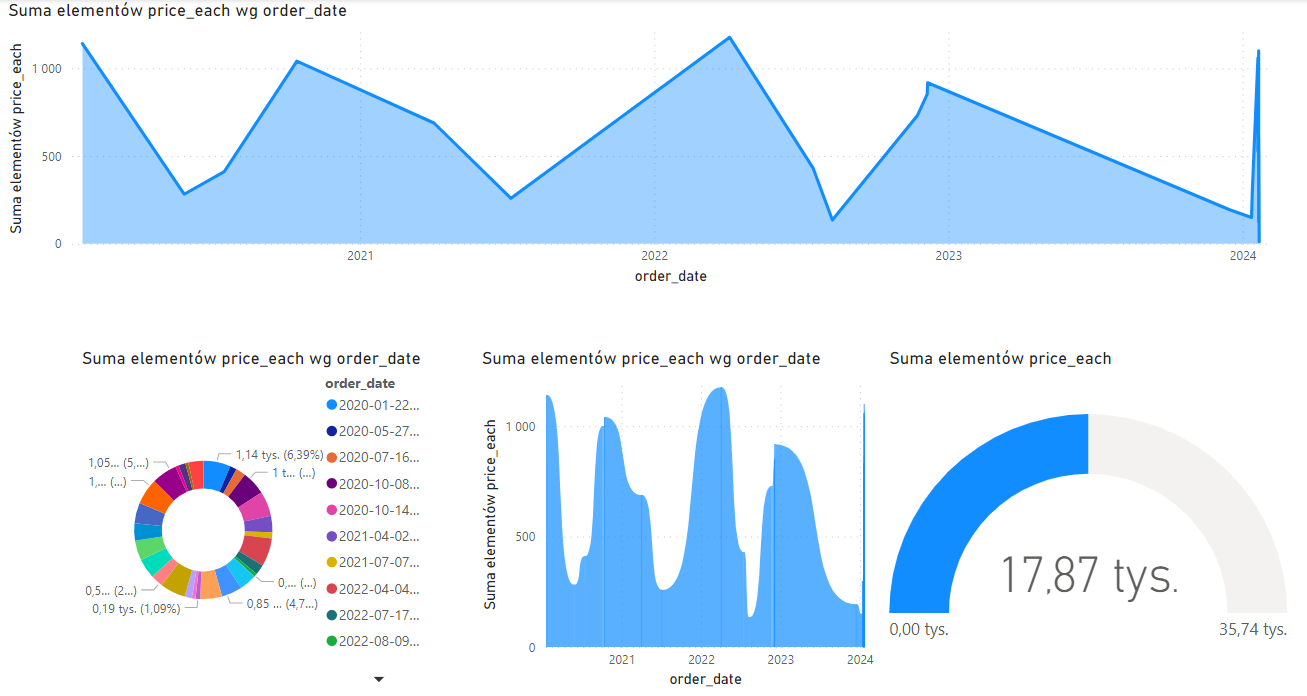
The quality of sales/processes can also be analyzed in the Power BI system. Those who have seen it - know it.
To send your data (from your system) to Power BI - you can use the Sykon Connector. We synchronize data from your system through the Rest API service. The connector is connected to PowerBI and the charts and analyses are updated online.
All you have to do is use the Rest Client and synchronize data with the Sykon Connector.
It’s really simple.
The solution requires a small programming commitment on the part of the company using it. We help in this process. The effects that the manager will see will be surprising.
Rest2PowerBI is a solution that allows for easy integration of the system with Power BI using the Connector.
It could be a sales system where one or more branches sell products.
It could be a production system where branches produce components and ship them to recipients.
The quality of sales or the state of the production process can be analyzed by managing managers in various ways. One way is to import data from the sales system into Excel.
After updating the data, you can then view previously prepared charts. And everyone can be happy.
The quality of sales/processes can also be analyzed in the Power BI system. Those who have seen it - know it.
To send your data (from your system) to Power BI - you can use the Sykon Connector. We synchronize data from your system through the Rest API service. The connector is connected to PowerBI and the charts and analyses are updated online.
Your system
Rest API
Connector
PowerBI
All you have to do is use the Rest Client and synchronize data with the Sykon Connector.
It’s really simple.
The solution requires a small programming commitment on the part of the company using it. We help in this process. The effects that the manager will see will be surprising.
Rest2PowerBI is a solution that allows for easy integration of the system with Power BI using the Connector.
This solution
connects your database with the PowerBI system.
A properly configured Connector can receive data that is updated online in PowerBI. Updated every 5 minutes, current sales summaries. Filters, comparisons and AI-powered analyses - you can have it all using Power BI. You can use our Connector for this purpose. Explore the possibilities and decide for yourself.
How does it work?
- 1. Data from your system is sent to the Connector via RestAPI.
- 2. The Connector, in Direct Query mode, transfers data to Power BI.
- 3. Power BI analyzes and visualizes your data, allowing you to see what you haven’t seen before.
When you sleep at night...
Rest2PowerBI constantly transfers current data of your system to Power BI...
so you can look at your data at any time.
Or maybe something else?
Perhaps your data will be supplemented with additional parameters and you will gain another dimension?
KPI, or Key Performance Indicator, are simple indicators that allow you to determine selected parameters related to efficiency.
Parameters for calculating KPI can of course be sent via Rest to the Connector.
Properly transferred data allows for immediate calculation of the values of selected KPI indicators.
Without the need to mark, copy and recalculate data - all this is immediately available to your team in PowerBI.
Key Performance Indicators… and new possibilities are ready for you to discover.
Rest2PowerBI
This is a new look at the analysis of your data
Yes,
While browsing this website
at least once, your data may have been updated (without your participation) in the PowerBI reports.
Great!
Would you like to start integrating your system with PowerBI?
Please contact us:
Get information from our specialist:
+48 91 35 00 161
biuro@sykon.pl
or fill out the form, we will answer all your questions
Your e-mail has been sent :)
Our advisor will contact you like this as soon as possible.
On behalf of the entire team, thank you for your interest and have a nice day.
On behalf of the entire team, thank you for your interest and have a nice day.
Form submission failed!